

Did you know that effectively reducing a product's environmental impact often starts with truly understanding where those impacts occur?
Calculating your product's carbon footprint is a first step, but the real power comes from identifying the specific parts of the product lifecycle, materials, or processes that contribute the most to that footprint.
Pinpointing these high-impact areas is where the greatest opportunity lies to implement effective reduction strategies.
Arbor’s platform helps visualize where you analyze your product's impact after it's been calculated. Our Hotspot Analysis feature lets you break down your product's footprint layer by layer, so you can focus your efforts on the areas that matter most for significant emissions reductions.
You can explore detailed emissions breakdowns, evaluate the impact of specific materials or activities, and model carbon impact across the full product lifecycle based on calculated data. Whether you're reporting emissions, optimizing your supply chain, or want to make smarter decisions based on real impact data, it's all in one place.
Use real data to guide your reduction efforts, not guesswork. Our Hotspot Analysis tool provides a measurable and interactive way to understand your product’s footprint after it has been quantified.
Here’s how Arbor’s Hotspot Analysis works and helps you target emissions effectively.
Hotspot Analysis

Arbor’s Hotspot Analysis feature allows you to deeply understand the environmental impact of your products by pinpointing the specific sources of carbon emissions within their lifecycle.
Overview
Understanding where your product's emissions come from is the crucial first step towards reducing its environmental footprint. Arbor's Hotspot Analysis provides a clear, detailed breakdown of your product's carbon impact, enabling you to isolate and target the most significant emission contributors quickly.
This detailed view empowers you to focus your sustainability efforts where they will have the greatest impact, whether it's optimizing materials, refining manufacturing processes, or improving transportation efficiency.
Arbor’s platform offers detailed Hotspot Analysis, helping you identify significant sources of embedded emissions within your supply chain, enabling targeted strategies for reduction and improvement.
How it works
Using the Hotspot Analysis in Arbor is straightforward once your product's carbon footprint is calculated:
- Calculate Your Product’s Carbon Footprint: First, ensure you have accurately entered all the necessary information across the relevant tabs in the platform to calculate your product's total carbon footprint.
- Navigate to the Analysis Tab: After your footprint is calculated, go to the dedicated "Analysis" tab within the platform.
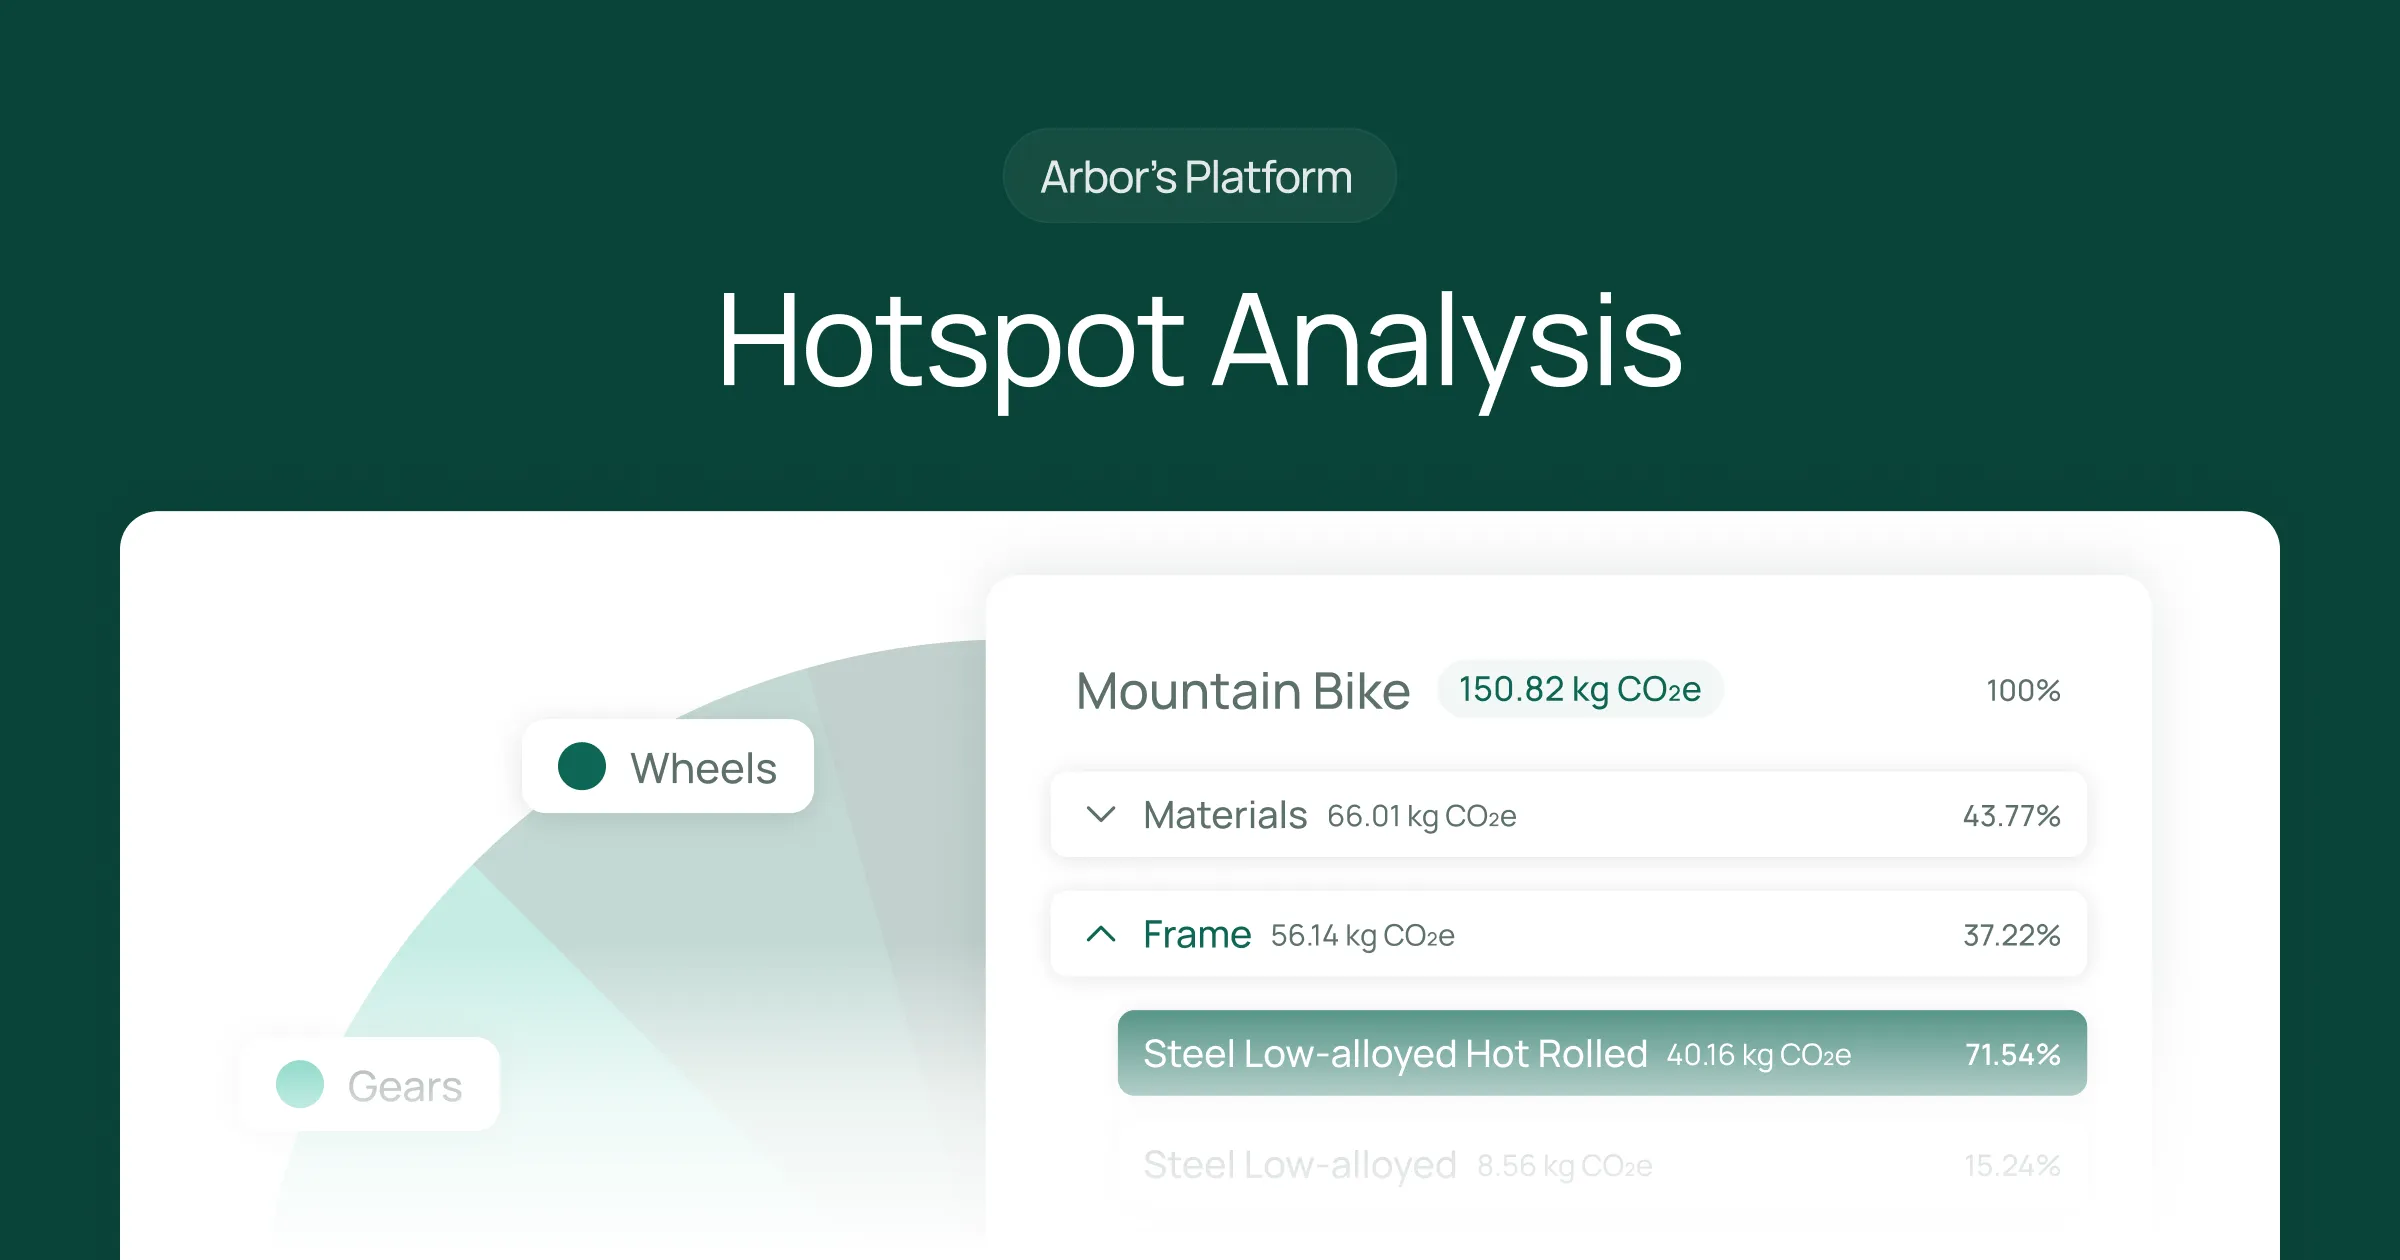
- Explore the Hotspot Analysis: Here, you will see the Hotspot Analysis view. You can explore different emission sources of your product, change how the data is grouped for various perspectives, and interact with a visual pie chart representation of the breakdown.
This feature allows you to see the carbon impact breakdown of your product and any included subcomponents. You can click through sections with dropdowns to reveal further layers of emissions breakdown, sometimes going many layers deep, giving you powerful insights into the largest emitting areas.
Key features
The Hotspot Analysis tool offers several key features to help you gain detailed insights into your product's carbon footprint:
Interactive emission breakdown
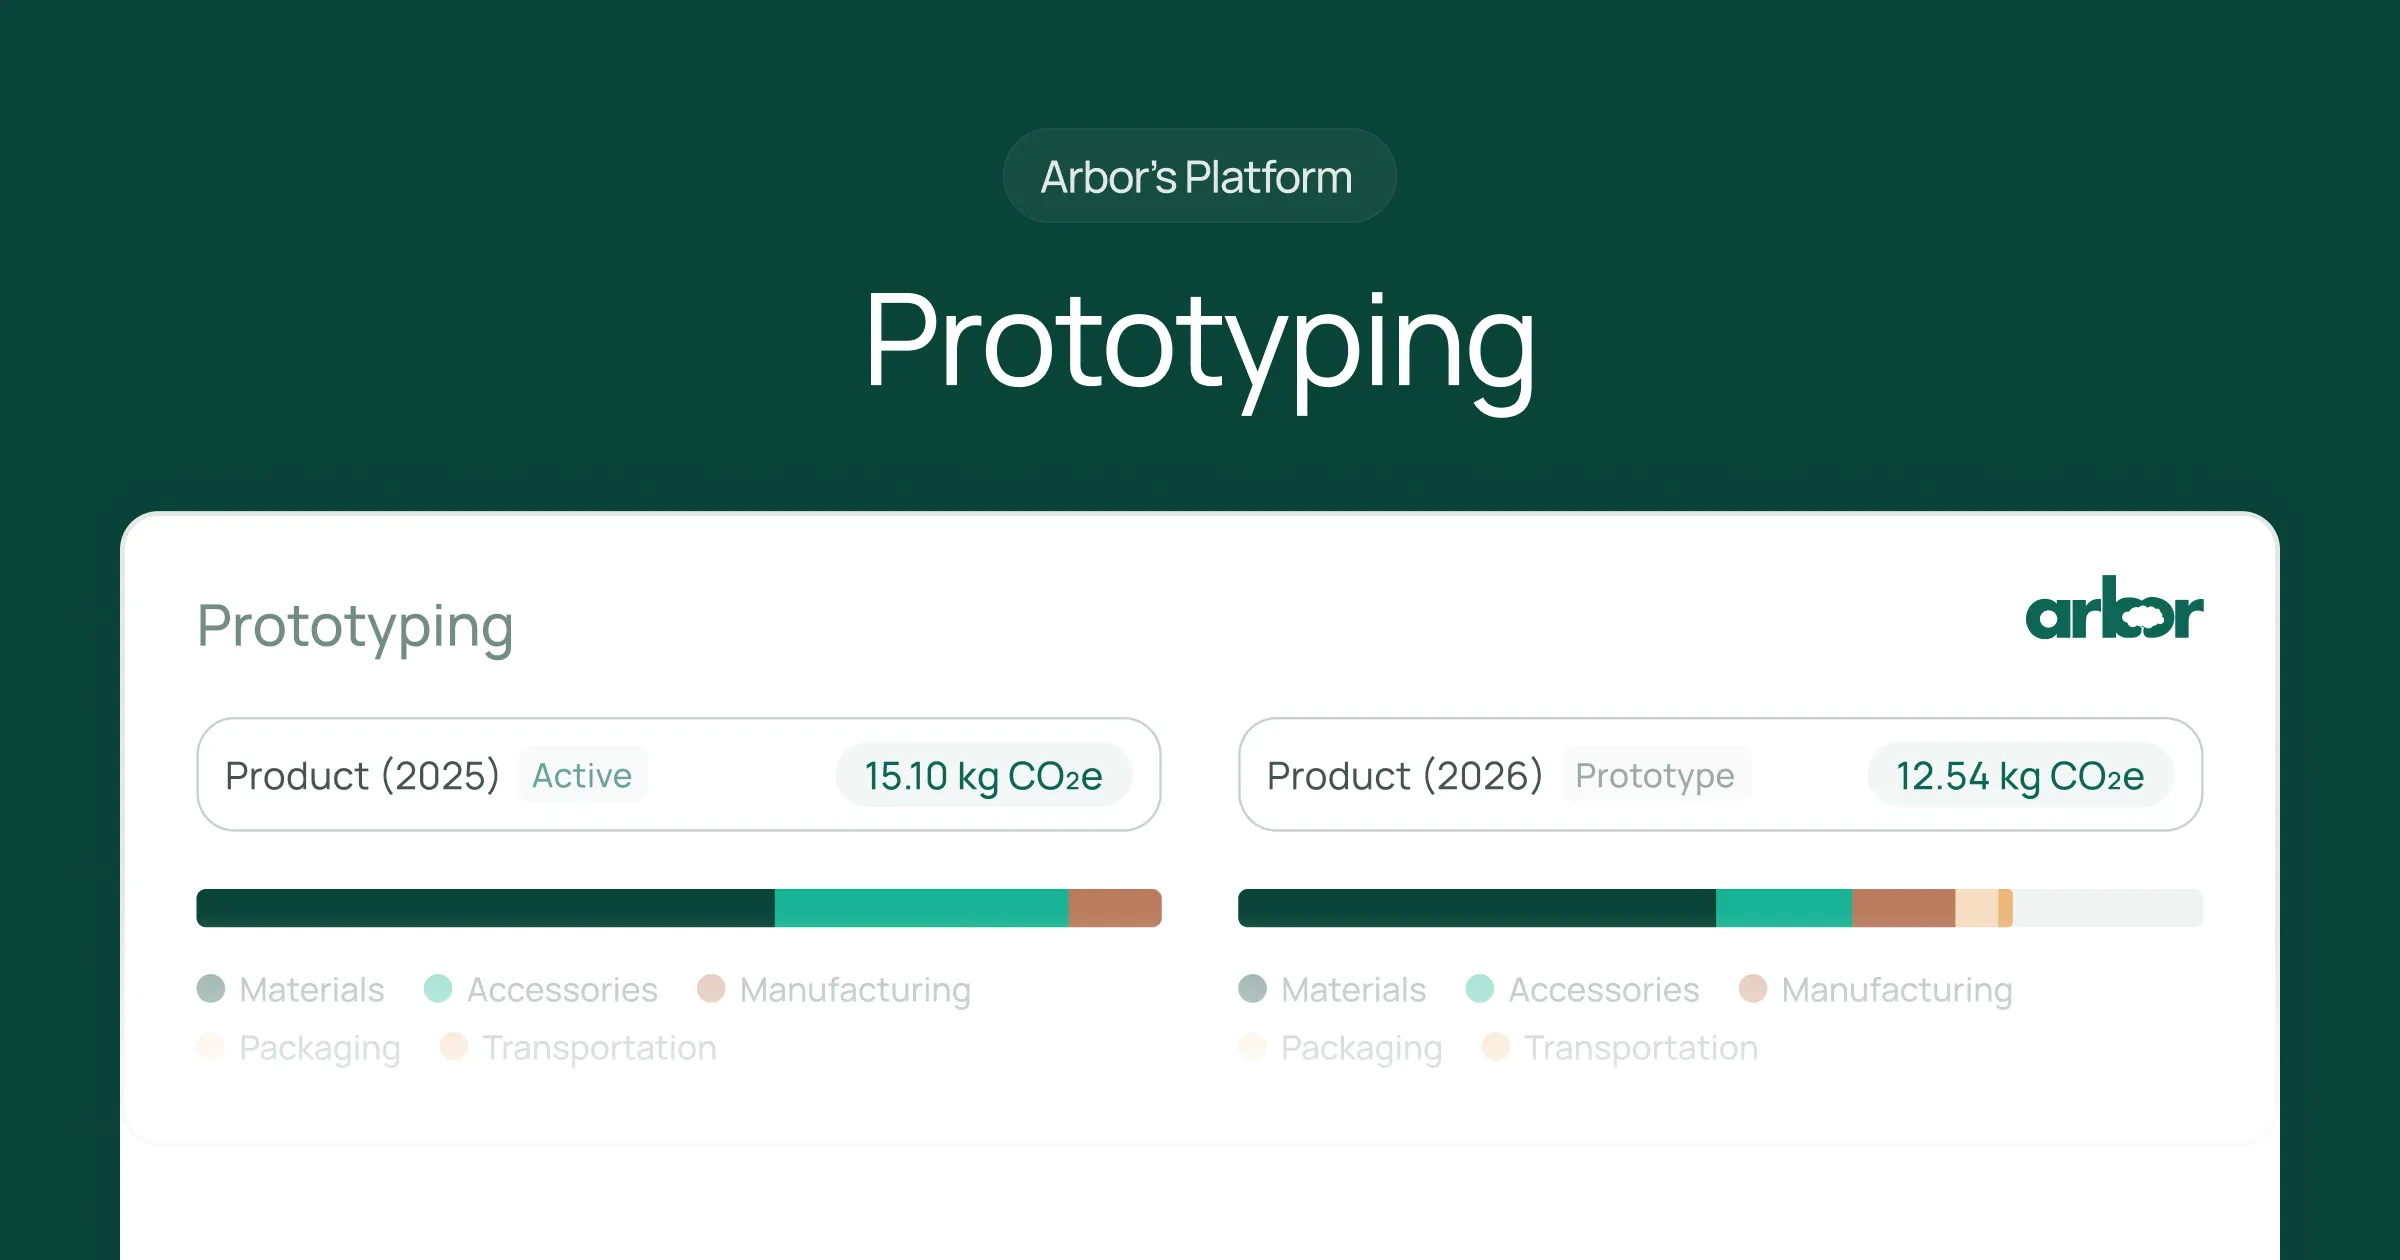
Easily visualize the distribution of your product's carbon footprint through an interactive pie chart (as seen in the accompanying image). This chart provides a clear, immediate understanding of which areas contribute the most to the total impact.
Flexible grouping
Analyze your data from different perspectives with two primary grouping methods:
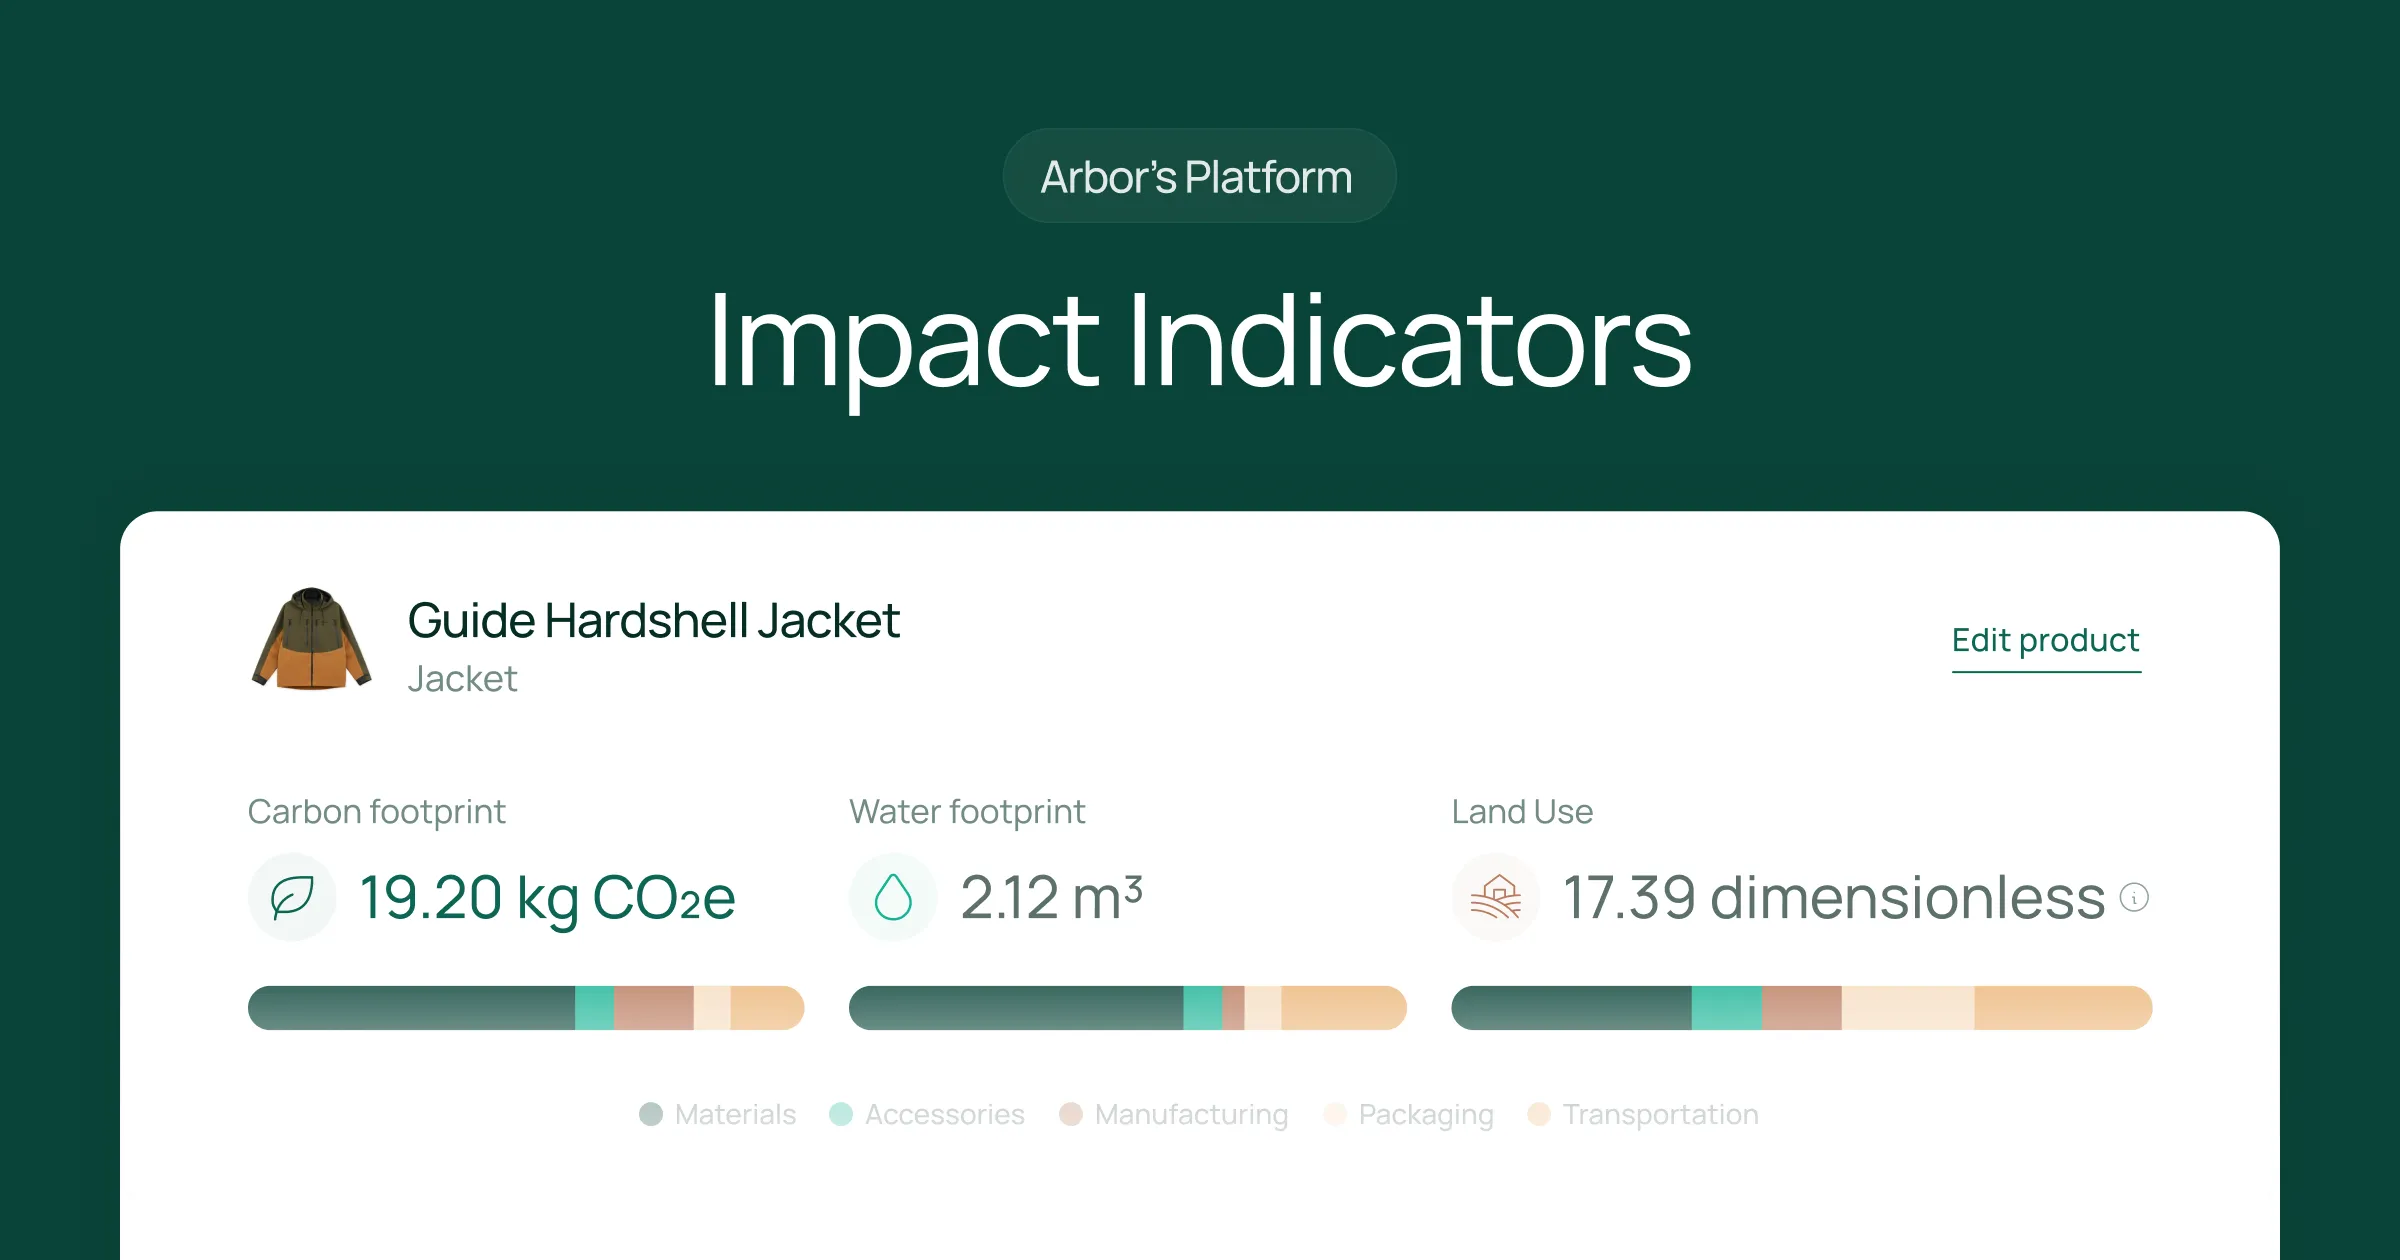
- Group by Lifecycle Stage (default view): View the breakdown by standard lifecycle phases, including Materials, Accessories (if applicable), Manufacturing, and Transportation.
- Group by Materials: Understand the contribution of each specific material or process to the overall carbon footprint.
Deep dive into hotspots

The Hotspot Analysis allows you to click into different sections and drill down into the data. You can explore multiple layers, sometimes up to 7-8 levels, to precisely identify the specific materials, activities, or processes that drive emissions.
For example, you can see the impact breakdown of a single material in relation to the entire product, or trace emissions within a complex manufacturing process.
How Hotspot Analysis helps you
By providing a granular and interactive view of your product's environmental impact, the Hotspot Analysis feature empowers you to make data-driven decisions for sustainability.
Arbor provides detailed insights into value chain carbon intensity, and the Hotspot Analysis enables you to zero in on high-impact activities, prioritizing what matters most for reduction and improvement.
- Identify Key Contributors: Quickly pinpoint the materials, manufacturing processes, or transportation methods that are the largest sources of emissions.
- Targeted Reduction Strategies: Develop focused and effective strategies to reduce your carbon footprint by addressing the identified hotspots.
- Optimize Product Design and Sourcing: Use insights from the analysis to inform decisions on material selection, suppliers, and design iterations for a lower environmental impact.
- Communicate Impact Clearly: Easily visualize and share the breakdown of your product's environmental impact with stakeholders using interactive charts and detailed data.
How to get access
The Hotspot Analysis feature is available to you directly within Arbor’s platform once you've calculated your product's carbon footprint. This feature is live now, ready to help you identify the key sources of your product's emissions.
If you're ready to move beyond just a carbon footprint number and gain the insights needed for targeted decarbonization, you can start measuring your product’s carbon footprint today and begin identifying its hotspots.
Summary
Understanding your product's carbon footprint is essential, but knowing where those emissions originate is what truly enables effective action. Arbor's Hotspot Analysis feature provides the critical next step after calculating your footprint, allowing you to dissect your product's environmental impact and pinpoint the specific sources of emissions within its lifecycle.
This powerful tool moves you beyond a single number to a detailed, interactive view, showing you exactly which materials, manufacturing processes, or transportation activities are contributing the most. By identifying these key "hotspots," you can focus your efforts strategically for maximum impact.
Here are some benefits from visualizing your hotspots with Arbor:
- Identify and Visualize: Easily see the breakdown of your product's footprint with interactive charts and flexible grouping options (by lifecycle stage or materials).
- Deep Dive for Precision: Drill down multiple layers into the data to uncover the specific elements driving emissions.
- Enable Targeted Reduction: Use precise insights from the Hotspot Analysis to develop and implement effective strategies to reduce the most significant sources of your product's emissions.
Ultimately, Arbor's Hotspot Analysis empowers you to make data-driven decisions, prioritize your sustainability initiatives, and focus on the areas that will yield the most significant environmental improvements for your products.
Measure your carbon emissions with Arbor
Simple, easy carbon accounting.
FAQ about Hotspot Analysis
What is a Hotspot Analysis?
A Hotspot Analysis in the context of product carbon footprints is a method used to identify the specific stages, processes, or materials within a product's lifecycle that contribute the most significantly to its overall environmental impact, particularly carbon emissions.
How to do a Hotspot Analysis in Arbor?
In Arbor, after calculating your product's carbon footprint, navigate to the "Analysis" tab. There, you will find the Hotspot Analysis feature, which displays a breakdown of emissions by lifecycle stage or material. You can interact with charts and click into categories to explore deeper layers of data.
What is a Hotspot Analysis in LCA?
In Life Cycle Assessment (LCA), a Hotspot Analysis is a standard practice to highlight the life cycle stages, unit processes, or inputs that have the largest environmental impacts. This helps prioritize where efforts should be focused for environmental improvement.
How to perform a Hotspot Analysis in LCA?
Performing a Hotspot Analysis in LCA involves completing the inventory and impact assessment phases of the LCA to quantify emissions or other impacts across the product's life cycle. The results are then analyzed to identify the largest contributors or "hotspots." Tools like Arbor automate this analysis based on your product data.
How to use Hotspot Analysis?
Use Hotspot Analysis to gain insights into your product's carbon footprint breakdown. This helps you identify the biggest drivers of emissions, allowing you to develop targeted strategies for reduction, such as switching to lower-impact materials, optimizing transportation routes, or improving manufacturing efficiency.
What is a Hotspots Analysis (HSA)?
Hotspots Analysis (HSA) is another term for Hotspot Analysis, referring to the process of identifying significant environmental or social impacts within a product's value chain or lifecycle.
What is the Hotspot Analysis method?
The Hotspot Analysis method involves systematically breaking down a product's total environmental impact (like carbon emissions) into its constituent parts (materials, manufacturing, transport, etc.) and quantifying the contribution of each part to identify which ones are disproportionately large contributors or "hotspots."
What is the difference between Hotspot Analysis and a heatmap?
Hotspot Analysis is a method to identify significant impact areas within a dataset or system (like a product lifecycle). A heatmap is a visual representation where data values are depicted as colours, often used to display the results of a Hotspot Analysis or to show intensity distribution over an area.
What is a Hotspot in climate change?
In the context of climate change generally (not specific to product footprints), a "climate hotspot" can refer to a geographical area experiencing rapid or significant changes in climate, or an area with high vulnerability to climate impacts. Within product footprints, a "carbon hotspot" refers to a significant source of greenhouse gas emissions in the product's lifecycle.
How to make an accessible life cycle Hotspot Analysis?
Making a life cycle Hotspot Analysis accessible involves presenting the results clearly and understandably, often using visualizations like interactive charts (like Arbor's pie chart), clear breakdowns by category, and the ability to drill down into detail. The goal is to make complex LCA data actionable for a wider audience, not just LCA experts.


.webp)
%20Directive.webp)


.webp)


%20Arbor.avif)


%20Arbor.avif)


.avif)


%20Arbor%20Canada.avif)

.avif)
%20Arbor.avif)
.avif)


_.avif)
.avif)
%20Arbor.avif)


%20Software%20and%20Tools.avif)


.avif)
.avif)


%20EU%20Regulation.avif)


.avif)


%20Arbor.avif)


_%20_%20Carbon%20101.avif)


.avif)


